
Software / System Tools →Task Explorer 1.2.9
Published by: LeeAndro on 11-10-2020, 17:59 |  0
0

File Size : 25.7 Mb
Task Explorer is an advanced Task Manager tool with emphasis on, not just monitoring what applications are running, but on finding out what applications are doing.
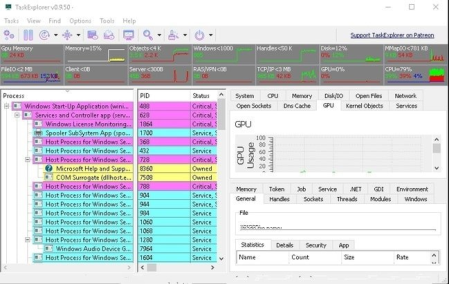
The UI focuses on expedience and getting real data of what the processes are doing at any given moment. Relevant data are provided in easy to access (as less clicks as possible) panels, with no need to open windows or windows of sub windows, instead additional information's for selected entries are shown in the lower half of the panel. Allowing to browse the detailed information's using arrow keys. And most data are refreshed continuously, as seeing the dynamic of values often grants additional insight.
The Thread Panel contains a stack trace for the selected thread giving even more insight in wat the selected application is doing right now. This is also very useful to debug deadlocks or performance issues. The processes memory can be viewed and edited from the Memory Panel, which provides an advanced memory editor and string search capability. In the Handles Panel all open handles are shown, with useful information's like file name the current file position and size, these allow to see what a program is actually working on right now disk wise. The Socket Panel shows all open connections/sockets per process providing also data rate information, in the settings one can enable the display of pseudo UDP connections created from ETW data. That is every destination endpoint for UDP packets will be shown as an own entry in the sockets panel allowing to monitor with whom a program is communicating. The Modules Panel shows all loaded dll's and memory mapped files, allowing to unload them as well as to inject a dll. And many more panels like Token, Environment, Windows, GDI, .NET, etc.. By double clicking on a process, the Task Info panels can be opened in a separate window enabling the viewing of properties of multiple processes simultaneously.
The system monitor aspect of the application is also well developed. The toolbar provides decently sized graphs providing not just CPU usage but also usage of Objects, handles, network and IO/disk access. The system info panels show All Open Files in the system, All Open Sockets by programs, and the services Panel allows viewing and controlling all system services including drives. The performance panels for CPU, Memory, Disk I/O, Network and GPU provide large graphs showing the usage of system resources in a detailed manner. The System info panel can be collapsed completely providing more space for the Task info panels. So Instead being a panel of the main window, or additionally, the system info panels can be opened in an own window using the appropriate toolbar button.
DOWNLOAD
uploadgig
rapidgator
nitroflare
Related News
-
{related-news}

